


There is no doubt that the loyalty of players ultimately affects the revenue in the free-to-play games. Usually, 80-90% of income in such games is prevalently gained from the “whales” – players who pay a lot. It means that if you increase your loyalty, you’ll improve your monetization. That’s why each game developer should know what players think of your game. So how might one understand that users don’t like your game? Here’s the list of main signs from devtodev.
Users Don’t Return
Players who do not like the game do not return, which is obvious. First of all, you should check Retention Day 1 because it shows users’ impression from their first session. It shows whether they like the visual style of the project, understand its purpose and are interested in it. If players don’t like your game from the first sight, Retention Day 1 will show you that. Moreover, it makes sense to work with the Retention Day 0 – the share of users who have launched your game for the second time during the 24-hours period since the first launch. This quick metric is great for monitoring changes related to the first session. The higher the Retention Day 0 is, the more users like your game.
Also, there are cases when Retention Day 1 is quite high, and Retention Day 7 is low. It may mean that the players played the game a bit more and saw something they did not like. When working with retention, it is important to understand whether your calculations are based on the calendar days (in this case, Retention Day 1 is the share of users that return on the next calendar day) or hours (when the users return 24 hours after the first launch). This difference is especially relevant for those projects where players are spread across different time zones. In this case, retention calculated by hours will give more accurate results.
At devtodev, we have implemented both options – the retention by calendar and by the 24h intervals: 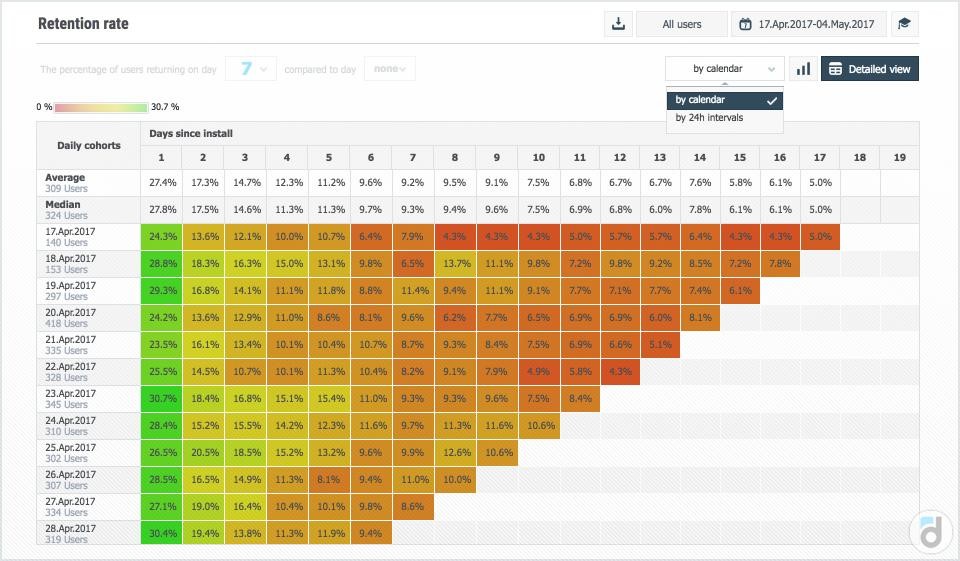 Users do not play regularly
Here is one more retention metric – Sticky Factor. It shows how attractive the project is in terms of monetization – the more involved your players are, the more loyal they get. Sticky Factor is calculated as the average daily audience divided by the average monthly audience. This value can vary from 3% to 100%. As a rule, the sticky factor of successful projects is higher than 20-25%. It indicates how “sticky” your project is, or how regularly users open it. Your should aim for the higher Sticky Factor. Our researches show that this metric has a strong correlation with the share of paying users. Make sure to measure sticky factor every month and draw conclusions regarding the changes in your game.
Users Leave
Churn Rate is the percentage of your users who cancel or don’t renew their subscriptions during a given time period. If players don’t like the game level or it is too complex for them, they leave. Your task is to understand what preceded this step, on which level the player was and how many attempts to pass the level have been undertaken.
Users Don’t Recommend Your Game to Their Friends
Loyal users usually share information about the game and recommend it to their friends. If the project is viral enough, their friends invite other people and so on. If your game is viral, you can conquer the market very quickly.
The indicator used for measuring the virality is borrowed from epidemiology and is called the K-factor. It shows how many friends one active user averagely brings into the project. It can be calculated in several different ways, but we propose you the following formula:
K-factor = (organic downloads for the period n+1) / (active users for the period n)

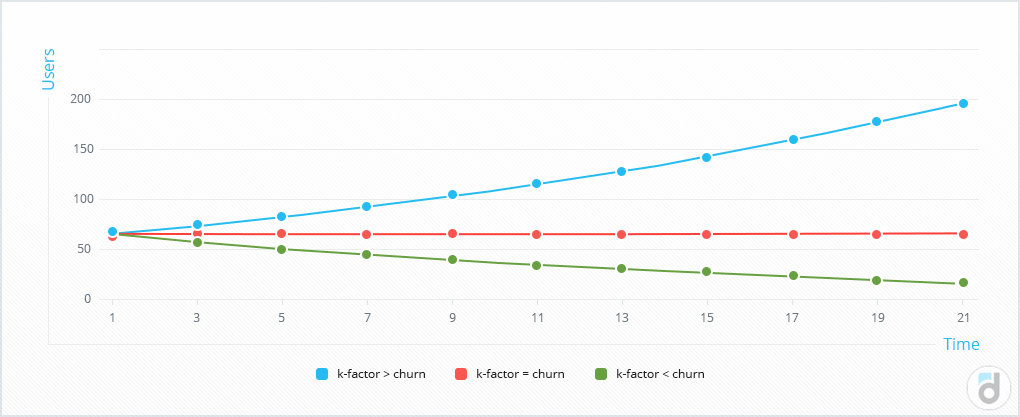
What is the period in this formula? It can be a week, month, year or any other period, which you define for your game. This metric is not used for bench marking as it is not clear how other people calculate it and for which period, but the K-factor is very useful when you look at its dynamics and try to explain its growth and decline.
It is very important that the K-factor is bigger than your Churn Rate. If it is so, the project will grow exponentially. If the K-factor is less than the Churn Rate, the audience is going to gradually decrease. When comparing both metrics, it is important that their values are calculated for the same period!
Users Don’t Pay
Loyal users pay. You will not pay for the game that you don’t like, will you? Also, your ARPU will decrease. ARPU (Average Revenue Per User) is the amount of income that is on average produced by one active user over a specific period of time. To calculate the ARPU, you need to divide the revenue for the selected time period by the active audience:
ARPU = Revenue / Active Users
Users Play Less
Reducing the Average Session Length shows that your game is not attractive for players anymore. You can calculate this metric in this way:
Average session length = total sessions length / number of sessions
If after the release the duration of the sessions has increased, this may indicate that the release was successful, and the users managed to make it stay longer in the product. And if this is the case, and user interest has increased, then this means that financial metrics are likely to increase, and with them retention.
Loyal users usually give feedback and openly share what they like and dislike about your game.